Building FleetFlowsFull-Stack Fleet Tracking: CAN Bus to Cloud at Scale (Currently Live)

The Requirement
Fleet management companies face a critical problem: they need real-time visibility into their vehicles' health, location, and driver behavior, but existing solutions at the time were either too expensive (above $20-30/vehicle/month) or required invasive installations that void vehicle warranties.
I built FleetFlows based on a client requirement. This is an end-to-end SaaS that reads CAN bus data directly from vehicles, processes telemetry in real-time, and scales to hundreds of concurrent connections. Target latency was sub-200ms end-to-end, infrastructure budget capped at $10/month for the first 50 vehicles. The technical constraints drove most of the architectural decisions.
Architecture Overview

The system spans four major layers, each designed with production-grade security and scalability in mind:
Hardware Layer
STM32F091CC + SN65HVD230 CAN transceiver + A7672S 4G Modem
Reads: RPM, Speed, Fuel, Coolant Temp, GPS coordinates
Cloud Layer
AWS IoT Core (X.509 Certificate Authentication)
Managed MQTT broker with built-in device authorization
Backend Layer
Microservices on AWS Lightsail (Docker Compose)
IoT Ingestion • Storage Service • WebSocket Gateway • Payment Service
Frontend Layer
React + Socket.io + MapLibre GL Maps (Vercel)
Real-time dashboard with account-based data isolation
Part 1: Hardware Layer — Reading the Vehicle's Brain
The CAN Bus Challenge
Modern vehicles use CAN (Controller Area Network) bus — a protocol where every electronic control unit (ECU) broadcasts data constantly. The challenge: every manufacturer uses different CAN message IDs and data formats. For example, in Tata Ace BS-IV/BS-VI models, Speed data comes on PGN/ID 0xF005 (61445) or 0x0100 (Speedometer), bytes 2-3 (Wheel-based vehicle speed) requiring the formula (raw value / 256) km/h, while engine coolant temperature data is on PGN/ID 0xFEEE (65262) or 0x0105, byte 1 (ECT) with formula (raw value - 40)°C. Getting this wrong means displaying nonsensical data or potentially damaging the vehicle's network.
The important part here is to understand that each vehicle, even between model years and trims, has different CAN frames and protocols of communicating. Some vehicles will not send you raw CAN data when you listen to all messages, in which case, you need to poll for the same by sending in specific "request" CAN messages to the vehicle, and it'll return the requested frame to you.


Reverse Engineering
This meant I had to research and reverse engineer quite a lot of CAN frames coming from specific vehicles, and make a dictionary out of that. This essentially boils down to sniffing CAN data (F-CAN not B-CAN) from vehicles, dumping into large logs, then filtering and putting various formulae on each frame raw data to check if we get meaningful values or not.
After 1-2 weeks of doing this, I had a meaningful set of data for many common fleet vehicles, which meant moving forward to the hardware next, where I focused on making the tracker a single-piece product with a proper PCB with temperature and vibration tolerance, moving away from test connections.
Hardware Lookup
Initially I tested the hardware stack on 4-5 different MCU and external module development boards, with breadboard or prototype PCB connections being used between all. This was important to get MQTT connections to securely work along with the A7672S modem, with SSL, which AWS IoT needs.


MCU & modem selection would play a significant role in the future viability and cost-to-make for each tracker device, along with other factors such as power consumption, features such as debuggability, memory or flash headroom, in-built CAN, power/sleep states and the like - All of which greatly influenced my design.
| MCU | Core clock max (MHz) | Power consumption | In-built CAN ph. | SRAM (kb) | Flash (kb) | Unit Price (INR) |
|---|---|---|---|---|---|---|
| ESP32-S2 (Xtensa LX7) | 240 | Deep Sleep:(~20 µA), Active:(~95 mA-240 mA) | No | 320 | 128 | ~120 |
| STM32F401RET6 | 84 | Deep Sleep:(~10-42 µA), Active:(~12 mA-20 mA) | No | 96 | 512 | ~330 |
| STM32F072CBT6 | 48 | Standby:(~2.3-7 µA), Active:(~13 mA-20 mA) | Yes | 16 | 128 | ~128 |
| STM32F091RCT6 | 48 | Standby:(~2-3 µA), Active:(~13 mA-15 mA) | Yes | 32 | 256 | ~154 |
| STM32L432KCU6 | 80 | Deep Sleep:(~28-280 nA), Active:(~6 mA-10 mA) | Yes | 64 | 256 | ~246 |
As observed on the table, I tested the stack on 4-5 different MCU development boards with external module boards, with breadboard or prototype PCB connections being used between all. This was important to get MQTT connections to securely work along with the A7672S modem, with SSL, which AWS IoT needs.
Each had it's trade-off, the ESP32 was overkill and it's WiFI/BT didn't justify the high power consumption as this project doesn't need any of them. Switching to STM32 MCUs gave better industrial characteristics, such as increased temperature range, decreased power consumption, and better hardware debugging and PCB designs support. Eventually, considering that I could remove the external MCP 2515 CAN module by choosing an MCU with in-built CAN controller, I came to the final design.
The same process went behind the selection choices for the modem. SIM800 modules, though very cheap to acquire, were out of question as 2G has been phased out pretty much everywhere. Similarly, SIM7000 modules seemed way too overkill with upto 150MBps transfer speeds. NB192 IOT modules are much more power efficient but they need specialized NB-IoT networks, which are not as widespread yet in even major carriers in countries such as India. So the network constrain was 4G CAT1 / 5G, the modem chip had to be relatively cheap and readily available with good AT command stability and support.
Final Hardware Stack
The hardware I finally selected used production automotive/industrial-grade components:
Microcontroller
STM32F091CC
- 48MHz ARM Cortex-M0
- 32KB SRAM, 256KB Flash
- 12x 12-bit ADC channels
- Industrial temperature range (-40 to +105 °C)
CAN Interface
STM32F091CC CAN controller + SN65HVD230 CAN transceiver
- 8MHz crystal oscillator
- Upto 1 Mbit/s CAN bus support
- Digital IO RXD/TXD communication to MCU
- TVS diode protection
Connectivity
A7672S 4G LTE + GNSS Modem
- UART communication
- Integrated GPS receiver
- Dual SIM support
- MQTT client library
Power System
Automotive-Grade
- 12V vehicle input
- MP1584EN switching DC-DC converter (5V)
- AMS1117 LDO (3.3V)
- 1.5A inline fuse protection
Display
I2C OLED 0.96" 128x64
- Initial device registration claim QR code display
- Modem and transmission status display
- Publishing active status via tactile button
- Shows critical errors
User control
4-Pin Tactile Push Button
- Toggles device publishing
- Updates state on OLED display
- Debounced logic

And below is the V1 tracker hardware that I built into a proper casing, a 3D-printed shell with the PCB, screen and antennas, packaged into a deployable product. The footprint is small and easily hides behind vehicle dashboards where it is to be installed. I designed the V1 case in CAD with Fusion360, and 3D printed using automotive high temperature and vibration tolerant ASA filament.

Connection Strategy
I used the standard OBD-II port which is present on most vehicles after 2002, avoiding voiding warranties by direct CAN tapping gauge cluster CAN lines. This required locating pinouts for SAE J1850 Bus, ISO 15765-4 and ISO9141 CAN/K-line on the OBD2 vehicle female connector, for which I used a DB9-OBD2 connector initially, mapping matching pins and soldering splice connectors without cutting factory wires, and adding TVS diode protection with a 1.5A fuse for safety.


Part 2: Firmware Architecture — The Edge Brain
The STM32 firmware (C/C++ with STM32CubeIDE) handles the critical edge processing and security handshake with the cloud. Every design decision here was driven by constraints: 32KB of RAM, intermittent 4G connectivity, and the need for sub-200ms response times.
Core Responsibilities
- 1. Device Registration & Provisioning
- • Generate UUID from STM32 unique ID
- • Create 8-character claim code (base36)
- • Register with backend via HTTPS POST
- • Receive X.509 certificate for AWS IoT Core
- • Store certificate in flash (secure storage)
- 2. CAN Profile Management
- • Fetch vehicle-specific CAN profile from server
- • Parse JSON and store in flash memory
- • Support hot-swapping without reflashing
- • Fallback to generic OBD-II if profile unavailable
- 3. CAN Data Decoding
- • Get incoming frames from SN65HVD230 (at vehicle baud rate)
- • Match CAN IDs against loaded profile
- • Apply formulas with big-endian extraction
- • Decode: RPM, Speed, Fuel %, Coolant Temp, etc.
- • Validate data ranges (prevent sensor errors)
- 4. Telemetry Publishing
- • Batch GPS + CAN metrics
- • Compress data (zlib for payload reduction)
- • Publish to AWS IoT Core via MQTT over TLS
- • Topic: vehicles/{device_uuid}/telemetry
- • Configurable interval (default: 5 seconds)
- 5. Connection Management
- • 4G LTE with exponential backoff reconnection
- • MQTT over TLS 1.2 (mutual authentication)
- • Keep-alive mechanism (60s ping)
- • Button-triggered TX enable/disable (data conservation)
- 6. Security Layer
- • Encrypted flash storage for certificates
- • Hardware random number generator with salt for nonce ("number used once")
- • Secure boot verification
- • OTA firmware updates with signature verification
The CAN Profile System
To constrain what exact vehicle users are allowed to work with, I added in another DB table for vehicle catalog entries (Admin accounts). This means logged in users can only add new tracked vehicles/specific can profiles by make, model and year-range filters, based only on available catalog, with sanitisation on backend for the same. This secured the server-managed CAN profile system. Instead of hardcoding vehicle-specific parameters in firmware, the device fetches a JSON profile on boot. This means I can add support for new vehicle models without touching the hardware — just create a profile in the admin panel.
// Example CAN Profile (stored on server)
{
  "make": "Honda",
  "model": "Accord",
  "year_min": 2008,
  "year_max": 2012,
  "baud_rate": 500000,
  "profile_data": {
    "speed": {
      "can_id": "0x158",
      "start_byte": 4,
      "length": 2,
      "formula": "value / 100",
      "unit": "km/h"
    },
    "rpm": {
      "can_id": "0x1DC",
      "start_byte": 1,
      "length": 3,
      "formula": "(value / 500) * 2",
      "unit": "rpm"
    },
    "fuel_level": {
      "can_id": "0x3B3",
      "start_byte": 2,
      "length": 1,
      "formula": "(value / 255) * 100",
      "unit": "%"
    }
  }
}
Bandwidth Impact: Segregating data per vehicle this way meant edge processing reduced bandwidth from ~20MB/hr to ~150KB/hr. Critical for cellular deployments. This meant exponentially less cost per vehicle per month. Another positive effect of this is reduced power consumption due to less calculations on the microcontroller.
Device claiming process: The great part about this segregation was that I now switched to a persistent, hardware-efficient HAL UUID generation, using STM's own HAL to get the unique hardware UUID for generating the salted claim code for a user. I switched to a 1.3" OLED instead of a 0.91" OLED used before, so that I could display this claim code both as text and a phone-scannable QR code. If a user scans this QR via regular camera app, they get a link which will direct them to the frontend site with this claim code as an argument, where once the user logs in, user can claim the device into their account and link it. This gives the admin a one-click approach instead of manually typing claim codes. Eventually, an excel form import was added to the frontend as well, to allow an admin to mass-import and claim a batch of devices.


Part 3: Cloud Infrastructure — Secure MQTT at Scale
Why AWS IoT Core?
I evaluated several approaches for handling device connectivity. Running my own MQTT broker (Mosquitto on EC2) would require managing certificates, scaling, and availability. AWS IoT Core provided a managed solution with built-in security, automatic scaling, and pay-per-message pricing that made it cost-effective even at scale. To highlight what I wanted from an IoT endpoint -
TLS 1.2 Encryption
X.509 mutual authentication with device certificates
Device Authorization
IoT policies restrict topic access per device
Auto-Scaling
Unlimited concurrent connections, no broker management
Cost-Effective
$1 per million messages + generous free tier
Certificate Management & Security
Each device requires three components for authentication: Amazon Root CA 1 (public), a unique device certificate (per-device public key), and a private key that never leaves the device. When deploying at scale, every device batch gets its own certificate-key pair, deployed during device flashing stage by a company Admin. Devices are differentiated using the device_uuid in the message payload, along with a salted secret which can only be decrypted by server.
MQTT Topic Strategy
// Topic Architecture
vehicles/{device_uuid}/telemetry  → Device publishes telemetry
vehicles/{device_uuid}/commands   → Backend sends remote commands
vehicles/{device_uuid}/config     → Backend sends CAN profile updates

// IoT Policy (per-device authorization)
{
  "Version": "2012-10-17",
  "Statement": [
    {
      "Effect": "Allow",
      "Action": ["iot:Publish"],
      "Resource": ["arn:aws:iot:region:account:topic/vehicles/${iot:ClientId}/telemetry"]
    },
    {
      "Effect": "Allow",
      "Action": ["iot:Subscribe", "iot:Receive"],
      "Resource": ["arn:aws:iot:region:account:topicfilter/vehicles/${iot:ClientId}/*"]
    }
  ]
}
This policy ensures devices can only publish to their own telemetry topic and subscribe to their own command topics. Even if a certificate is compromised, the attacker cannot access other vehicles' data.
Part 4: Backend Architecture — Event-Driven Microservices with Zero-Trust Security
I designed the backend as loosely coupled microservices communicating via Redis pub/sub, with security enforced at every layer. This architecture provides independent scaling, fault isolation, and makes it easy to add new features without touching existing services. But more importantly, it implements zero-trust principles: every request is authenticated, every database query is scoped to the user's account, and data isolation is enforced at the database level.
IoT Ingestion Service
Node.js • MQTTSubscribes to AWS IoT Core MQTT topics, enriches telemetry with vehicle metadata, and publishes to Redis pub/sub. Implements rate limiting (~10 msg/sec per device during testing) to prevent abuse.
AWS IoT Core → Enrich with DB metadata → Redis Pub/Sub (telemetry-stream)Storage Service
Node.js • TimescaleDBBatches telemetry writes to database, preventing DB overload from high-frequency data. Uses LRU cache for vehicle-to-account lookups.
Redis Pub/Sub → Buffer (5min) → Batch INSERT (100 rows) → TimescaleDBWebSocket Gateway
Node.js • Socket.io • JWTHandles REST API + Socket.io with JWT authentication. Implements room-based architecture for account-scoped broadcasts. Row-Level Security queries ensure data isolation.
Redis Pub/Sub → Filter by account_id → Socket.io Rooms → FrontendPayment Service
Node.js • StripeStripe integration for subscriptions. Plans: Free (7 vehicle), Pro (50 vehicles), Enterprise (500+ vehicles). Webhook verification with cryptographic signatures.
Stripe Checkout → Webhook Verify → Update DB → Emit license changeRemote Logging
Node.js • StripeOne of the most important pieces on a backend, secure but reliable logging. I used Axiom for logging, which has a massive data ingestion capacity even on the free tier, without any latency issues. It has an online dashboard and filters to make it easy to identify normal, warning or critical events. Connection secrets stored on SSM make this secure too.
Vector service (Docker) → Websocket gateway global log/error handler with context messages → AxiomSecurity Architecture
My earlier iterations had client-supplied account_id in requests, when locally testing backend-frontend flow on docker. This was an obvious but temporary security hole, which was refactored to extract identity from cryptographically verified JWT tokens, added database-level Row-Level Security policies, and implemented account-scoped WebSocket rooms. Defense in depth at every layer.
Layer 1: JWT Token Verification
// Every request verifies the JWT from AWS Cognito
const verifyToken = async (token) => {
  const verifier = CognitoJwtVerifier.create({
    userPoolId: process.env.COGNITO_USER_POOL_ID,
    tokenUse: "id",
    clientId: process.env.COGNITO_CLIENT_ID,
  });

  try {
    const payload = await verifier.verify(token);
    return {
      userId: payload.sub,  // Cryptographically verified user ID
      email: payload.email
    };
  } catch (error) {
    throw new Error('Invalid token');
  }
};
The frontend can no longer "tell" the server who the user is. The server extracts the user's identity from the cryptographically signed token. Even if an attacker intercepts the request, they cannot forge a valid JWT without AWS Cognito's private key.
Layer 2: Row-Level Security (RLS)
Middleware checks are good, but database-level enforcement is better. Every query runs inside a transaction that sets PostgreSQL session variables. These variables are then used in Row-Level Security policies to physically restrict data access at the database level.
// Custom query helper that injects security context
const queryWithContext = async (accountId, role, queryText, params) => {
  const client = await pool.connect();
  try {
    await client.query('BEGIN');

    // Inject security context into PostgreSQL session
    await client.query(`
      SET LOCAL app.current_account_id = $1;
      SET LOCAL app.current_role = $2;
    `, [accountId, role]);

    // Execute main query (RLS policies automatically applied)
    const result = await client.query(queryText, params);

    await client.query('COMMIT');
    return result;
  } catch (error) {
    await client.query('ROLLBACK');
    throw error;
  } finally {
    client.release();
  }
};

// PostgreSQL Row-Level Security Policy
CREATE POLICY vehicles_select ON vehicles FOR SELECT
  USING (
    linked_account_id = current_setting('app.current_account_id')::uuid
  );

CREATE POLICY vehicles_modify ON vehicles FOR ALL
  USING (
    linked_account_id = current_setting('app.current_account_id')::uuid
    AND current_setting('app.current_role') IN ('Admin', 'Editor')
  );
Now, even if I or anyone who would change anything in the codebase down the line, forgets an authorization check in the application code, the database physically refuses to return data from other accounts. This is defense in depth.
Layer 3: WebSocket Room-Based Authorization
The initial WebSocket implementation broadcast telemetry to all connected clients during test phase. I then closed this hole by switching to Socket.io rooms, where users automatically join a room named after their account ID. Telemetry is only broadcast to the room of the vehicle owner. Moreover, the rooms join method in Socket.io is optimized to internally use hashmaps, making it much faster for lookups.
// WebSocket authentication at handshake
io.use(async (socket, next) => {
  const token = socket.handshake.auth.token;

  try {
    const decoded = await verifyToken(token);
    socket.userId = decoded.userId;

    // Fetch user's account and role
    const { accountId, role } = await getUserAccount(decoded.userId);
    socket.accountId = accountId;
    socket.role = role;

    // Join user's account room
    socket.join(`account:${accountId}`);

    next();
  } catch (error) {
    next(new Error('Authentication failed'));
  }
});

// Telemetry broadcast (account-scoped)
redisSubscriber.on('message', async (channel, message) => {
  const telemetry = JSON.parse(message);

  // Query vehicle owner (with LRU cache)
  const vehicleAccountId = await getVehicleAccountId(telemetry.linkedVehicleId);

  // Broadcast ONLY to the vehicle owner's room
  io.to(`account:${vehicleAccountId}`).emit('telemetry', telemetry);
});
This greatly reduced CPU usage more than three times from before, at 500+ vehicles and completely eliminated the data leak vulnerability. No more O(n) loops checking every socket — Socket.io rooms handle the filtering at the protocol level.
Technology Choices
TimescaleDB over MongoDB
Time-based data needs time-series databases. TimescaleDB (PostgreSQL extension) provides automatic time-based partitioning, 90% compression on old data, and SQL for complex joins. I can query "last 24 hours of telemetry for vehicles with engine temperature warnings" in 30ms.
-- Create hypertable (automatic partitioning by time)
SELECT create_hypertable('telemetry', 'time');

-- Add compression policy (90% storage reduction)
SELECT add_compression_policy('telemetry', INTERVAL '7 days');

-- Query last 24 hours (uses time-based indexes)
SELECT * FROM telemetry
WHERE linked_vehicle_id = $1
  AND time > NOW() - INTERVAL '24 hours'
ORDER BY time DESC;
Redis Pub/Sub over RabbitMQ
For telemetry, I don't need guaranteed delivery or persistent queues. Redis pub/sub provides microsecond latency and simpler setup. If a telemetry message is lost, the next one arrives in 5 seconds anyway. This trade-off dramatically simplified the architecture.
Part 5: Frontend — Real-Time Dashboard with Master Vehicle Catalog
Securing the backend so far, I also had to make sure the client company's Admin/Editor user(s) managing their fleet, would always have a smooth experience with good visual feedback on every page they visit on the console.
So I started building the blocks for each page the website would have, testing user flow for not just an account for lesser vehicles, but also accounts having a massive number of vehicles (2000+). Eventually, I went with the following setup -
Tech Stack
React and Vite with React DOM routing were obvious choices, along with Socket.IO for this project's dynamic needs, given that the site would definitely extend into AI based visuals down the line, meaning extending into more pages. Even at scale.
For realtime map views though, I had initially implemented Leaflet JS, a very popular library used for map views on sites. Though easier to incorporate, one major downside in Leaflet (as of this post) is that it uses raster graphics to render map sections. This was not only slow to render, but wasn't aesthetically pleasing either (heavy aliasing). I bit the bullet and switched to MapLibre GL, using MapTiler as the provider. The implementation is a little deeper, but the experience is miles ahead, with Vector graphics being used instead thanks to WebGL under it's hood.

Key Features
Being in the AWS ecosystem for this platform (Based on client's per/vehicle budget and preference), I took advantage of Cognito and SSM to manage authentication and secrets for server environment variables.
This allowed me to use AWS amplify along with Cognito JWT and sessions on react frontend, meaning exponentially more straightforward and scalable auth session and token management.
Unified Authentication Flow
// OAuth + Email/Password unified flow
1. User signs up via Google/Microsoft/Email
2. Redirected to callback page with Cognito token
3. Check if account exists in database
4. If not → profile completion form
5. Create account record with Cognito user ID
6. Navigate to dashboard with JWT stored in session
Real-Time Telemetry Updates
Room based Socket.io connections lets Socket automatically manage connections for same client accounts on multiple machines, or unique clients, efficiently, eliminating redundancy.
useEffect(() => {
  const initSocket = async () => {
    const session = await fetchAuthSession();
    const token = session.tokens?.idToken?.toString();

    const socket = io(API_URL, {
      auth: { token },  // JWT authentication at handshake
      transports: ['websocket']  // Skip polling
    });

    socket.on('connect', () => {
      console.log('Connected to telemetry stream');
    });

    socket.on('telemetry', (data) => {
      // Update vehicle card in real-time
      setLiveTelemetryDataSet(prev => ({
        ...prev,
        [data.linkedVehicleId]: data  // Immutable update
      }));
    });

    socket.on('disconnect', () => {
      console.warn('Telemetry stream disconnected');
    });
  };

  initSocket();
}, []);
Master Vehicle Catalog
To prevent data fragmentation (e.g., "Tata" vs "TATA" vs "tata"), I built a Master Vehicle Catalog with 100+ verified Indian vehicle makes and models. Users select from dropdowns instead of free-text entry, ensuring data consistency across the entire fleet. The site has a dedicated page for Admins to be able to import (individual form or CSV) new vehicle definitions, or export (Paginated) the current global definitions.
// Master catalog includes:
- 30+ Manufacturers: Tata, Mahindra, Ashok Leyland, etc.
- 200+ Models: Tata Ace, BharatBenz 1617R, Eicher Pro 2049, etc.
- Vehicle metadata: Gross Vehicle Weight, Engine Type, Fuel
- Standardized names (no duplicates or typos)

// Bulk import via Excel/CSV
- Upload spreadsheet with: registration_number, chassis_number, make, model
- Parse with SheetJS (supports .xlsx, .xls, .csv)
- Staging table pattern for idempotent inserts
- ON CONFLICT DO NOTHING (prevents duplicate registrations)
- Import 500+ vehicles in under 30 seconds

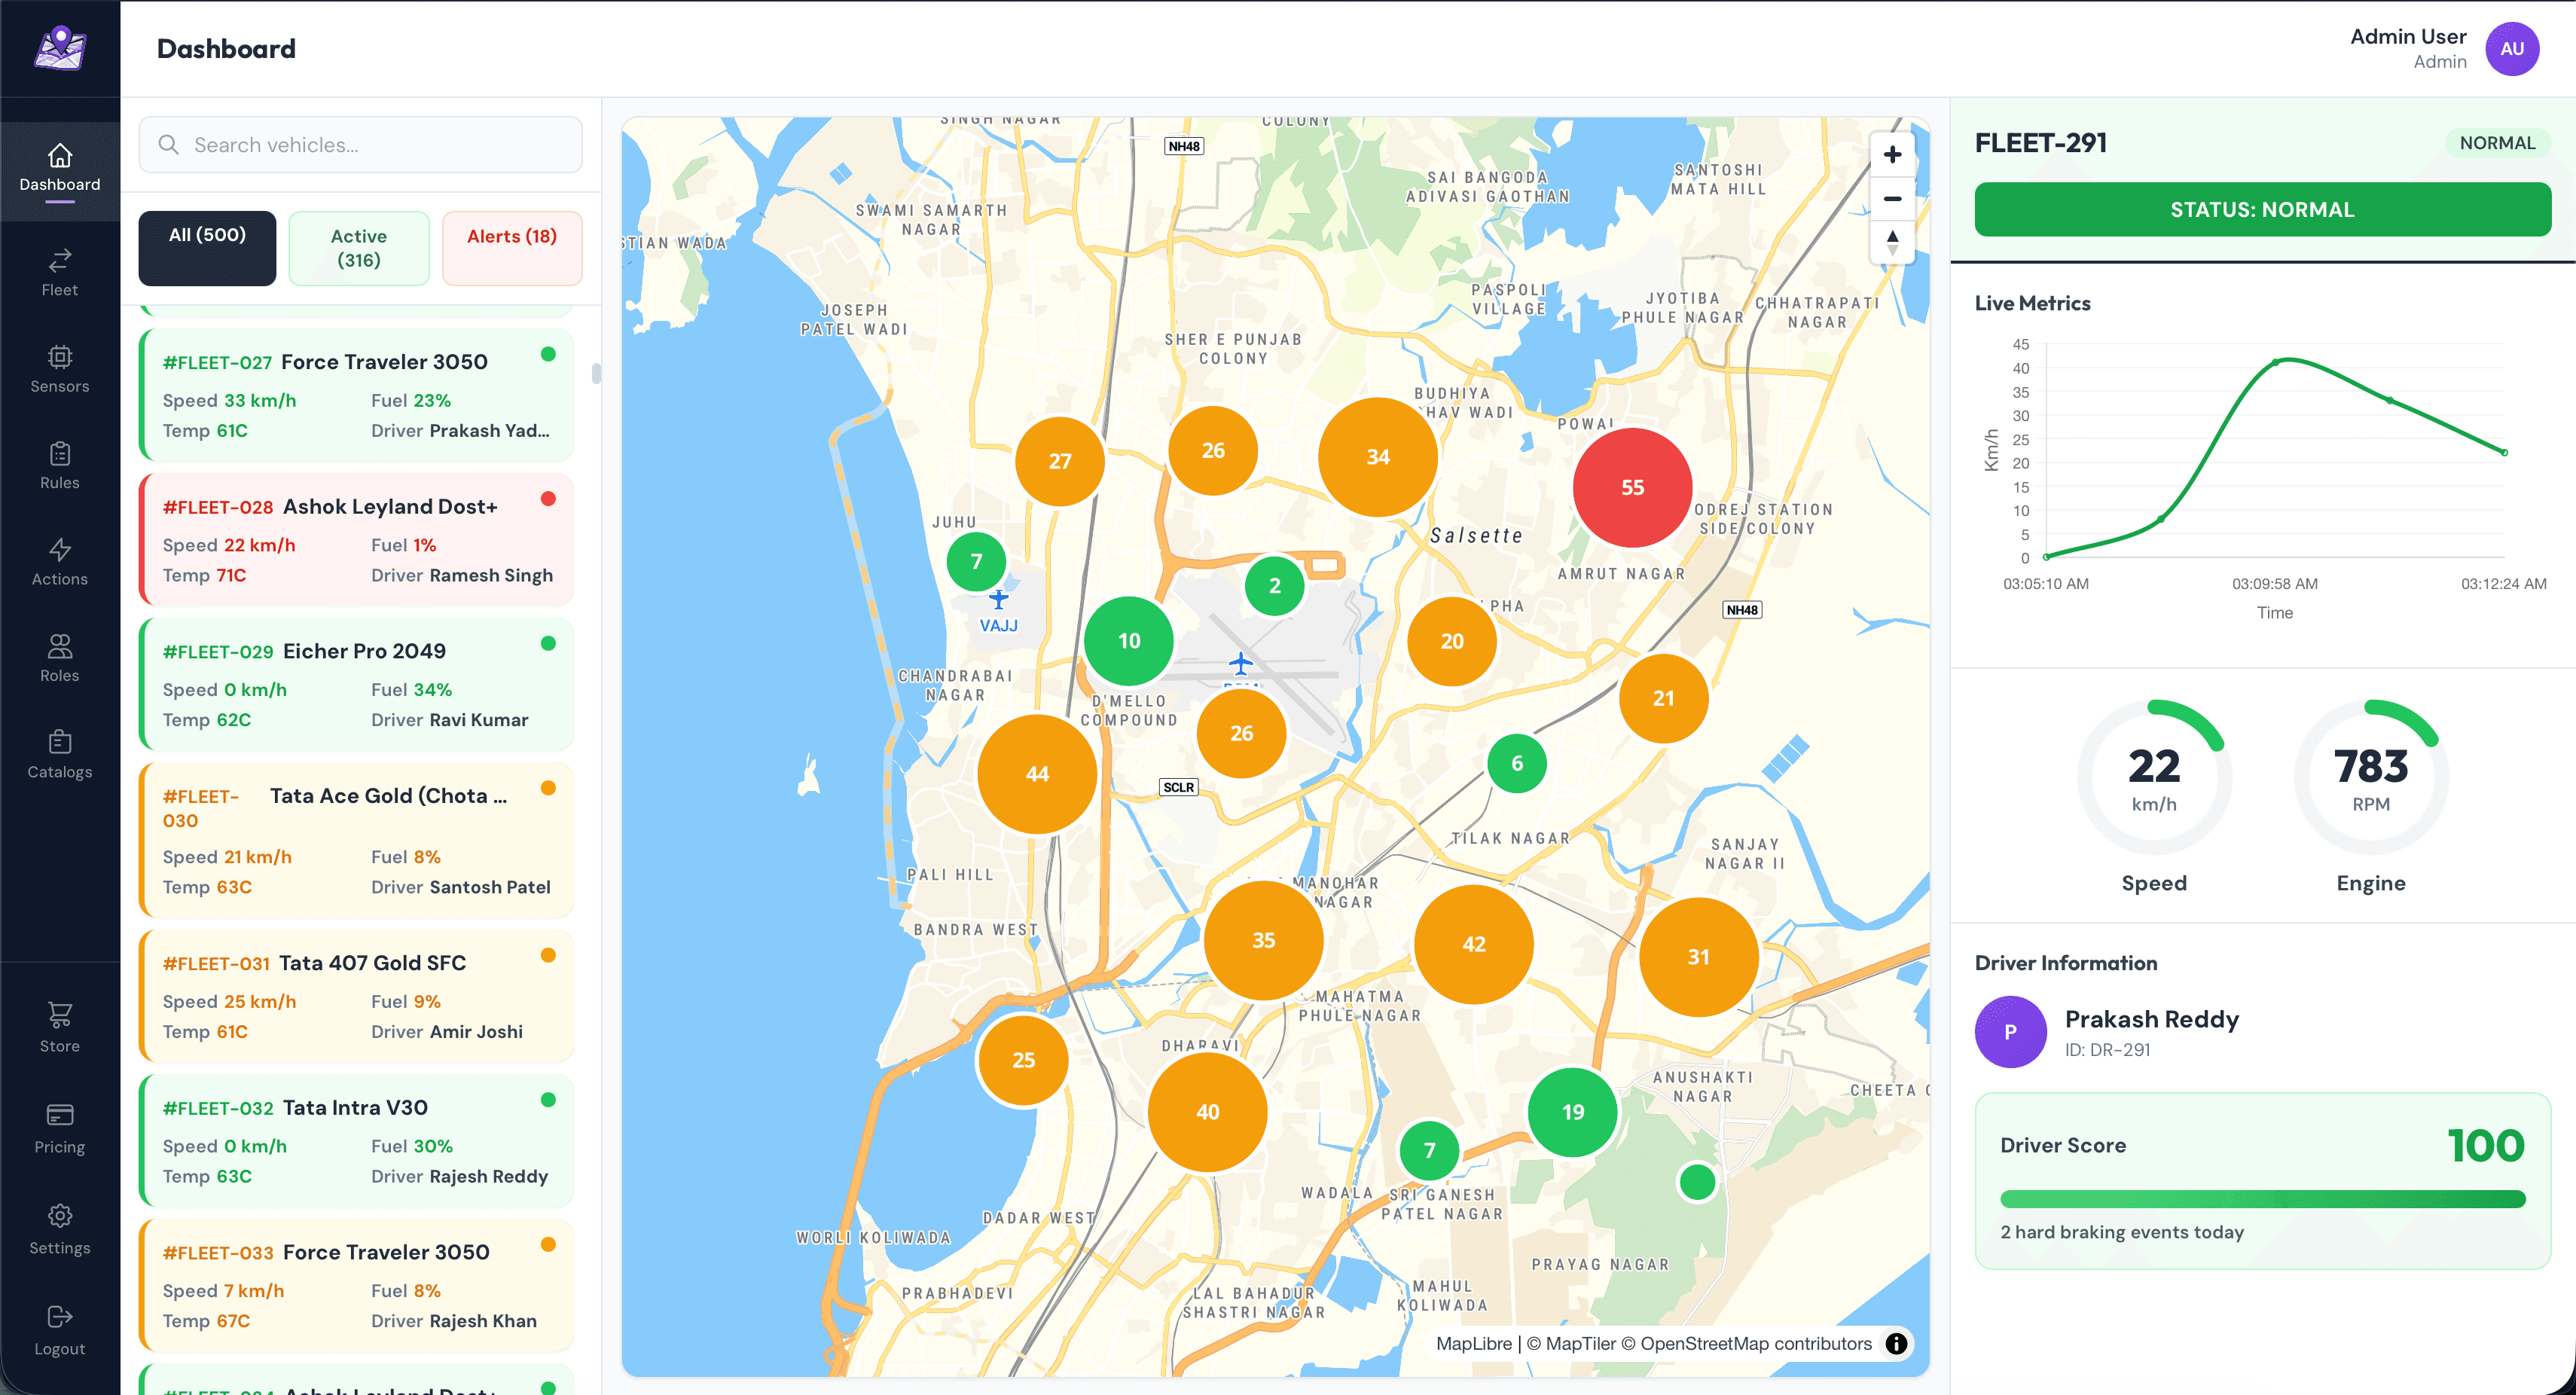
Dashboard Layout
The primary dashboard layout is segregated into three major blocks. This is the page a user first sees when logging into their account. The site has a persistent left-side vertical navigation bar which is how the user travels around the console.
Left Pane: Vehicle Cards
- Live metrics: Speed, RPM, Fuel %, Coolant Temp
- Status indicator: Green (active < 30s), Yellow (30-60s), Red (offline)
- Driver assignment with profile photo
- Click to focus on map and show detailed panel
Center: MapLibre Map
- Custom vehicle markers with numbered clustering (color-coded by health status)
- Real-time position updates (debounced to 1 update/sec)
- Route history with gradient trail (last 1 hour)
- Geofence visualization (entry/exit alerts)
Right Pane: Detailed View
- Radial gauges for Speed and RPM
- Live line chart (last 5 minutes of data)
- Driver score and behavior metrics
- Recent alerts and warnings
- User action area such as viewing history and trends
The navbar has bespoke sub-pages for actions, such as managing fleet vehicles, devices, drivers, or adding CAN profiles -

A logged in user can update their subscription anytime should they hit their limit, via the pricing page accessible from anywhere on dashboard -

Part 6: Production Deployment & Infrastructure
After looking at trade-offs with multiple server hosting solutions, I decided to go with AWS Lightsail based on use being in AWS ecosystem and the number of vehicles the client projected they would start with. This decision was done on purpose, starting with a low-cost single docker-compose incorporated ubuntu server with good recovery mechanisms in place.
This was due to the fact that although I could implement a full Kubernetes cluster, paired with AWS ALB, controlling VPN secured EC2 instances, the cost would be way out of budget for the client based on their vehicle projections for first few months on their stack. Using K8 pod would mean not just managing the complex deployment config at growing scale, but also managing replicas across server instances.
Besides, we could always switch to Kubernetes as our vertical scaling reached it's limit, especially since our server is already containerized. Moreover, I optimized server requirements exponentially by reducing payload size (Compression) and ping rate, reducing which by even a second seemed to show massive relaxation on server load at scaled simulation tests. I also optimized existing batched DB writes to reduce write intervals from the circular buffer on storage service on backend, while reducing the lifespan of telemetry event storage, based on client needs. This meant both server storage and CPU load were reduced.
The following came up to be our production stack for low/moderate loads to start with -
Backend: AWS Lightsail
4GB RAM, 2 vCPU, 20GB storage
- Ubuntu 22.04 LTS
- Docker Compose orchestration
- Caddy reverse proxy + auto SSL
- 5TB data transfer included
- Multi-project hosting (3-5 platforms per instance)
Frontend: Vercel
Automatic deployments from GitHub
- Global CDN (sub-100ms load times)
- Custom domain: fleetflows.app
- Environment variables for API URL
- Preview deployments for PRs
- Automatic HTTPS with edge caching
Caddy Configuration
As indicated before, the client wanted me to setup the server such that they could test another backend on the same (Which they would then eventually remove again respecting security isolation principles), so I set up reverse proxies and security headers accordingly.
// Caddyfile - Multiple domains on one instance
api.fleetflows.app {
    reverse_proxy localhost:3001

    @websocket {
        header Connection *Upgrade*
        header Upgrade websocket
    }
    reverse_proxy @websocket localhost:3001
}

Note: I've redacted other security details from here, which have been implemented.

// What Caddy Does (Automatically):
1. Obtains SSL certificates from Let's Encrypt
2. Renews certificates before expiry (every 60 days)
3. Redirects HTTP → HTTPS
4. Handles WebSocket upgrades
5. One config file for multiple domains
6. Zero-downtime certificate rotation
Part 7: Performance Optimizations
One very important thing I follow is the principle of isolation - When implementing/adding something, you must have test functions and less barriers to isolate errors for large scale requests, error states or edge cases. Hence, most of the backend and frontend functions were intentionally missing some textbook optimizations to check their viability, confirming which I added them all back in.
After initial testing at scale with multiple real concurrent vehicles and simulations, these are some of the optimizations I applied on backend and frontend when finalizing implementation -
Database: Strategic Indexing
-- Index for common query pattern
CREATE INDEX idx_telemetry_vehicle
ON telemetry(linked_vehicle_id, time DESC);

-- Result: ~1200ms → 40ms for "last 24 hours" queries

-- Connection pooling
const pool = new Pool({
  max: 20,                    // Reuse connections
  idleTimeoutMillis: 30000,   // Close idle after 30s
  statement_timeout: 10000    // Kill slow queries
});
Backend: Batched Writes
// Before: 100 INSERT statements/second
for (const data of telemetryData) {
  await pool.query('INSERT INTO telemetry VALUES ...', [data]);
}
// DB CPU: ~70%, Latency: ~400ms

// After: 1 INSERT every 5 minutes
const values = telemetryData.map((d, i) =>
  `($${i*10+1}, $${i*10+2}, ...)`
);
await pool.query(`
  INSERT INTO telemetry VALUES ${values.join(',')}
`, flatParams);
// DB CPU: ~15%, Latency: ~50ms
// Result: Exponentially fewer transactions without data loss
WebSocket: Keep-Alive Mechanism
// Detect and clean up dead connections
socket.on('pong', () => {
  socket.isAlive = true;
});

setInterval(() => {
  io.sockets.sockets.forEach((socket) => {
    if (!socket.isAlive) {
      socket.disconnect();
      return;
    }
    socket.isAlive = false;
    socket.ping();
  });
}, 30000);  // Check every 30 seconds
Frontend: Selective Re-renders
// Only update affected vehicle cards
setLiveTelemetryDataSet(prev => ({
  ...prev,
  [data.linkedVehicleId]: data  // Immutable update
}));

// Debounced GPS map updates
const debouncedMapUpdate = useMemo(
  () => debounce(updateMapMarkers, 1000),
  []
);  // At most once per second
Part 8: Challenges & Solutions
To articulate better, these were some of the many many challenges I faced during development cycle, and how I approached and solved them -
Challenge 1: CAN Bus Decoding Complexity
Every vehicle manufacturer uses different CAN IDs, byte positions, and formulas. Hardcoding these in firmware meant reflashing for each vehicle model — impractical for a fleet with mixed makes/models.
Server-managed CAN profiles. Devices fetch JSON profiles on boot and store them in flash. Admin creates profiles via UI. Result: Support new vehicles without touching hardware. Bandwidth reduced from more than 20MB/hr to ~200KB/hr.
Challenge 2: MQTT Disconnections on 4G
Mobile networks drop connections unpredictably. Lost messages meant missing telemetry. Initial implementation had infinite reconnection loops that drained cellular data.
I added in Exponential backoff reconnection logic with a max delay cap, to handle these cases which commonly happen when vehicle is out of network tower range.
unsigned long reconnectDelay = 3000;  // Start at 3s

while (!mqtt_connect()) {
  delay(reconnectDelay);
  reconnectDelay = min(reconnectDelay * 2, 60000);  // Max 60s
}

reconnectDelay = 3000;  // Reset on success
Challenge 3: WebSocket Scalability & Security
Broadcasting telemetry to all clients caused CPU spikes at 50+ vehicles. Worse, it leaked data — users could see telemetry from vehicles they didn't own. Though this was a testing phase issue, it is worth mentioning as an important point.
Account-based Socket.io rooms. Users join rooms named after their accountId. Telemetry is broadcast only to the matching room. Result: CPU usage reduced from ~50% + to less than 20%, also giving me complete data isolation in the process.
Challenge 4: Database Write Amplification
500 vehicles × 1 msg/5s = 100 writes/second overwhelmed PostgreSQL. Connection pool exhaustion, slow queries, occasional crashes.
I implemented a circular buffer, batched writes with 5-minute cycles. Collect messages in memory, batch INSERT every 5 minutes. Result: Exponentially fewer transactions, no data loss, database CPU usage dropped by more than double.
Challenge 5: STM32 Memory Constraints
Storing CAN profile JSON (5KB) in SRAM left only 27KB for application code, causing frequent memory allocation failures and stack overflows.
STM32 flash storage for persistent data. Store CAN profile in flash memory (256KB available), read once at boot, parse only when needed. SRAM usage dropped from more than 28KB to less than 20KB, providing headroom for future features.
Part 9: Scale Testing with 500+ Vehicles
To validate the architecture could handle real-world fleet sizes, I built a simulator that could spawn hundreds of virtual vehicles alongside the already deployed real batch of devices on actual test vehicles. The goal: ensure the system could maintain sub-200ms latency with 500+ concurrent connections.
Testing Methodology
Vehicle Simulator (Node.js)
- • Simulates STM32 device behavior
- • Connects to AWS IoT Core via MQTT
- • Publishes telemetry every 5 seconds
- • Randomized GPS routes (realistic movement)
- • Configurable CAN profiles
- • Can spawn 500+ instances on single VM
Test Mix
- • 498 simulated vehicles (various routes across India)
- • 20+ real STM32 devices (Tata Ace test vehicles)
- • More than 500 total concurrent connections to AWS IoT Core
Metrics Tracked
- • End-to-end latency (device to dashboard)
- • Database write latency
- • WebSocket broadcast time
- • Frontend rendering performance
- • Memory usage on Lightsail instance
- • Network bandwidth consumption
Results
(CAN bus → AWS IoT → Backend → Dashboard)
(Less than 3 in 1000 messages lost)
(Account-filtered to correct users)
(For a load of around 600 total concurrent vehicles)

Bottleneck Analysis
With large scale fleet vehicles, the bottleneck wasn't AWS IoT Core (which scales to no almost no end) or the microservices (easily horizontally scalable). It was the frontend rendering. Updating 500 vehicle cards 60 times per second caused browser frame drops. So I had to additionally implemented virtualized scrolling (react-window) to only render visible cards, reducing DOM nodes from 500 to ~15.
This is pretty much where map clustering was of huge help. Initially without clustered vehicle nodes rendered on map view on dashboard, the whole site lagged when we had even 200+ vehicles on a typical non-eGPU laptop displaying the site. With clustering enabled, not only was the map hugely less crowded, but I could render 2000+ nodes without the site lagging at all. Because the GET endpoints gave paginated responses, the load time for fleet management page's vehicle/driver/device lists with a massive number of entries, wasn't behind either.

Part 10: Key Learnings
Technical Insights
Decoupling services made debugging trivial. When the storage service crashed, telemetry kept flowing through Redis pub/sub. I could restart it without touching the ingestion or WebSocket services.
Single writes are the enemy of performance. Whether it's database INSERTs, API calls, or DOM updates — batching consistently gave 10-60x improvements.
Time-series data needs time-series databases. The automatic time-based partitioning and compression policies saved me from building custom archival logic.
Caddy + Let's Encrypt = HTTP is purely for test phase locally. Once in production, everything was switched out for HTTPS, and of course ongoing maintenance.
Simulators hide real-world issues. 4G disconnections, STM32 memory constraints, and CAN bus electrical noise only appeared when I tested in many actual vehicle, like Tata Ace.
I rewrote much of the backend to implement Row-Level Security. This was an iterative process taking weeks, as data points were added along the development cycle of the platform.
Architecture Decisions
My Implementation
- Redis pub/sub for ephemeral telemetry
- Docker Compose for orchestration
- Lightsail for cost-effective hosting
- JIT provisioned AWS IoT certificate
- Server-managed CAN profiles
- Socket.io rooms for account isolation
- Stripe for at-scale payment and transaction management
- Axiom for logging at scale
- GitHub Actions for proper VC and CI/CD
Trade-offs?
- MS Azure ecosystem instead of AWS, but Azure IoT is more expensive and limited than AWS IoT, AWS Cognito has sufficient config options for this platform for lesser cost at scale than Azure Entra ID, AWS Lightsail is cheaper than Azure VM for non-complex but still secure IoT workloads.
- AWS MSK (Kafka) instead of Redis Pub/Sub, but this would mean higher cost and latency with complex management. Also in this case, we don't need message retention for live telemetry events.
- Prometheus/Grafana instead of Axiom for monitoring, but both are overly complex for same functionality, and need managing infra for scaling/long-term storage
Version Control & DevOps
It was absolutely essential that I commit to both frontend and backend efficiently and keep a track of my changes, and setting up a repository on both backend server and frontend (vercel auto deploy) allowed me to directly publish changes right from inside Webstorm IDE.
There were times where I had to create a temporary branch and work there, before going back to main, in order to keep things clean. VC helps immensely here. Also, one important aspect of VC was that the client tech team could easily keep track of the development cycle of the platform, without redundant meetings for technical progress.

Tech Stack Summary
Hardware
- Microcontroller: STM32F091CC (48MHz, 32KB SRAM, 256KB Flash)
- CAN Interface: SN65HVD230 CAN transceiver
- Connectivity: A7672S 4G LTE modem
- Display: SSH1106 1.3" OLED (128x64)
- Power: MP1584EN + AMS1117 regulators
Firmware
- Framework: Platform.io (C/C++)
- Libraries: HAL, TinyGSM A7672S Fork, Adafruit GFX, MCP_CAN, AWS IoT
- MQTT: PubSubClient
- JSON: cJSON
Backend
- Runtime: Node.js 20
- Database: PostgreSQL 15 + TimescaleDB
- Cache: Redis 7 (pub/sub)
- API: Express.js + Socket.io
- Auth: AWS Cognito (OAuth + JWT)
- Payments: Stripe
Frontend
- Framework: React 19
- Build: Vite
- Maps: MapLibre GL + MapTiler
- Auth: AWS Amplify
- Styling: Tailwind CSS
- Real-time: Socket.io Client
Infrastructure
- IoT: AWS IoT Core (MQTT)
- Backend Hosting: AWS Lightsail (Ubuntu 22.04)
- Frontend Hosting: Vercel
- DNS: Cloudflare
- Reverse Proxy: Caddy 2
- Containers: Docker + Docker Compose
DevOps
- Version Control: Git + GitHub
- CI/CD: GitHub Actions + Vercel
- Monitoring: Docker logs, CloudWatch
- SSL: Let's Encrypt (via Caddy)
Conclusion
Production systems are mostly infrastructure. The real-time dashboard is a few thousand lines. But connection handling, security enforcement, write optimization, and failure recovery double the complexity. Most of the engineering effort goes into reliability, not features.
The most valuable skill I portrayed wasn't React or Docker or embedded C — it was system thinking: understanding how data flows through layers, where bottlenecks form under load, what breaks when networks are unreliable, and how to design for failure. Making this platform compelled me to think about security at every turn, as a foundational principle enforced at every layer from hardware certificates to database policies.
The final SaaS gives end-to-end capability across the entire IoT stack, production mindset with security and monitoring built-in, scalable architecture tested with 500+ concurrent vehicles and supporting 5000+ vehicles as there would be new customers with growing fleets, and the ability to work within real-world constraints: memory limits, unreliable networks, and tight budgets.
If you're building IoT systems, prioritize:
Links
- Live SaaS: https://fleetflows.app
Open Source Components Used
Development of this platform would be harder without TimescaleDB for time-series extensions, Caddy for making SSL trivial, AWS for generous IoT Core free tier, Vercel for frontend hosting, and the open-source community for countless libraries and tools.